Everything That Happens on a Raspberry Pi, Visible in One Click: The Device Activity Log
Reconnections, volume changes, software updates, network configurations applied or reverted. Now all of it is recorded, per device — no SSH access, no digging through server logs.
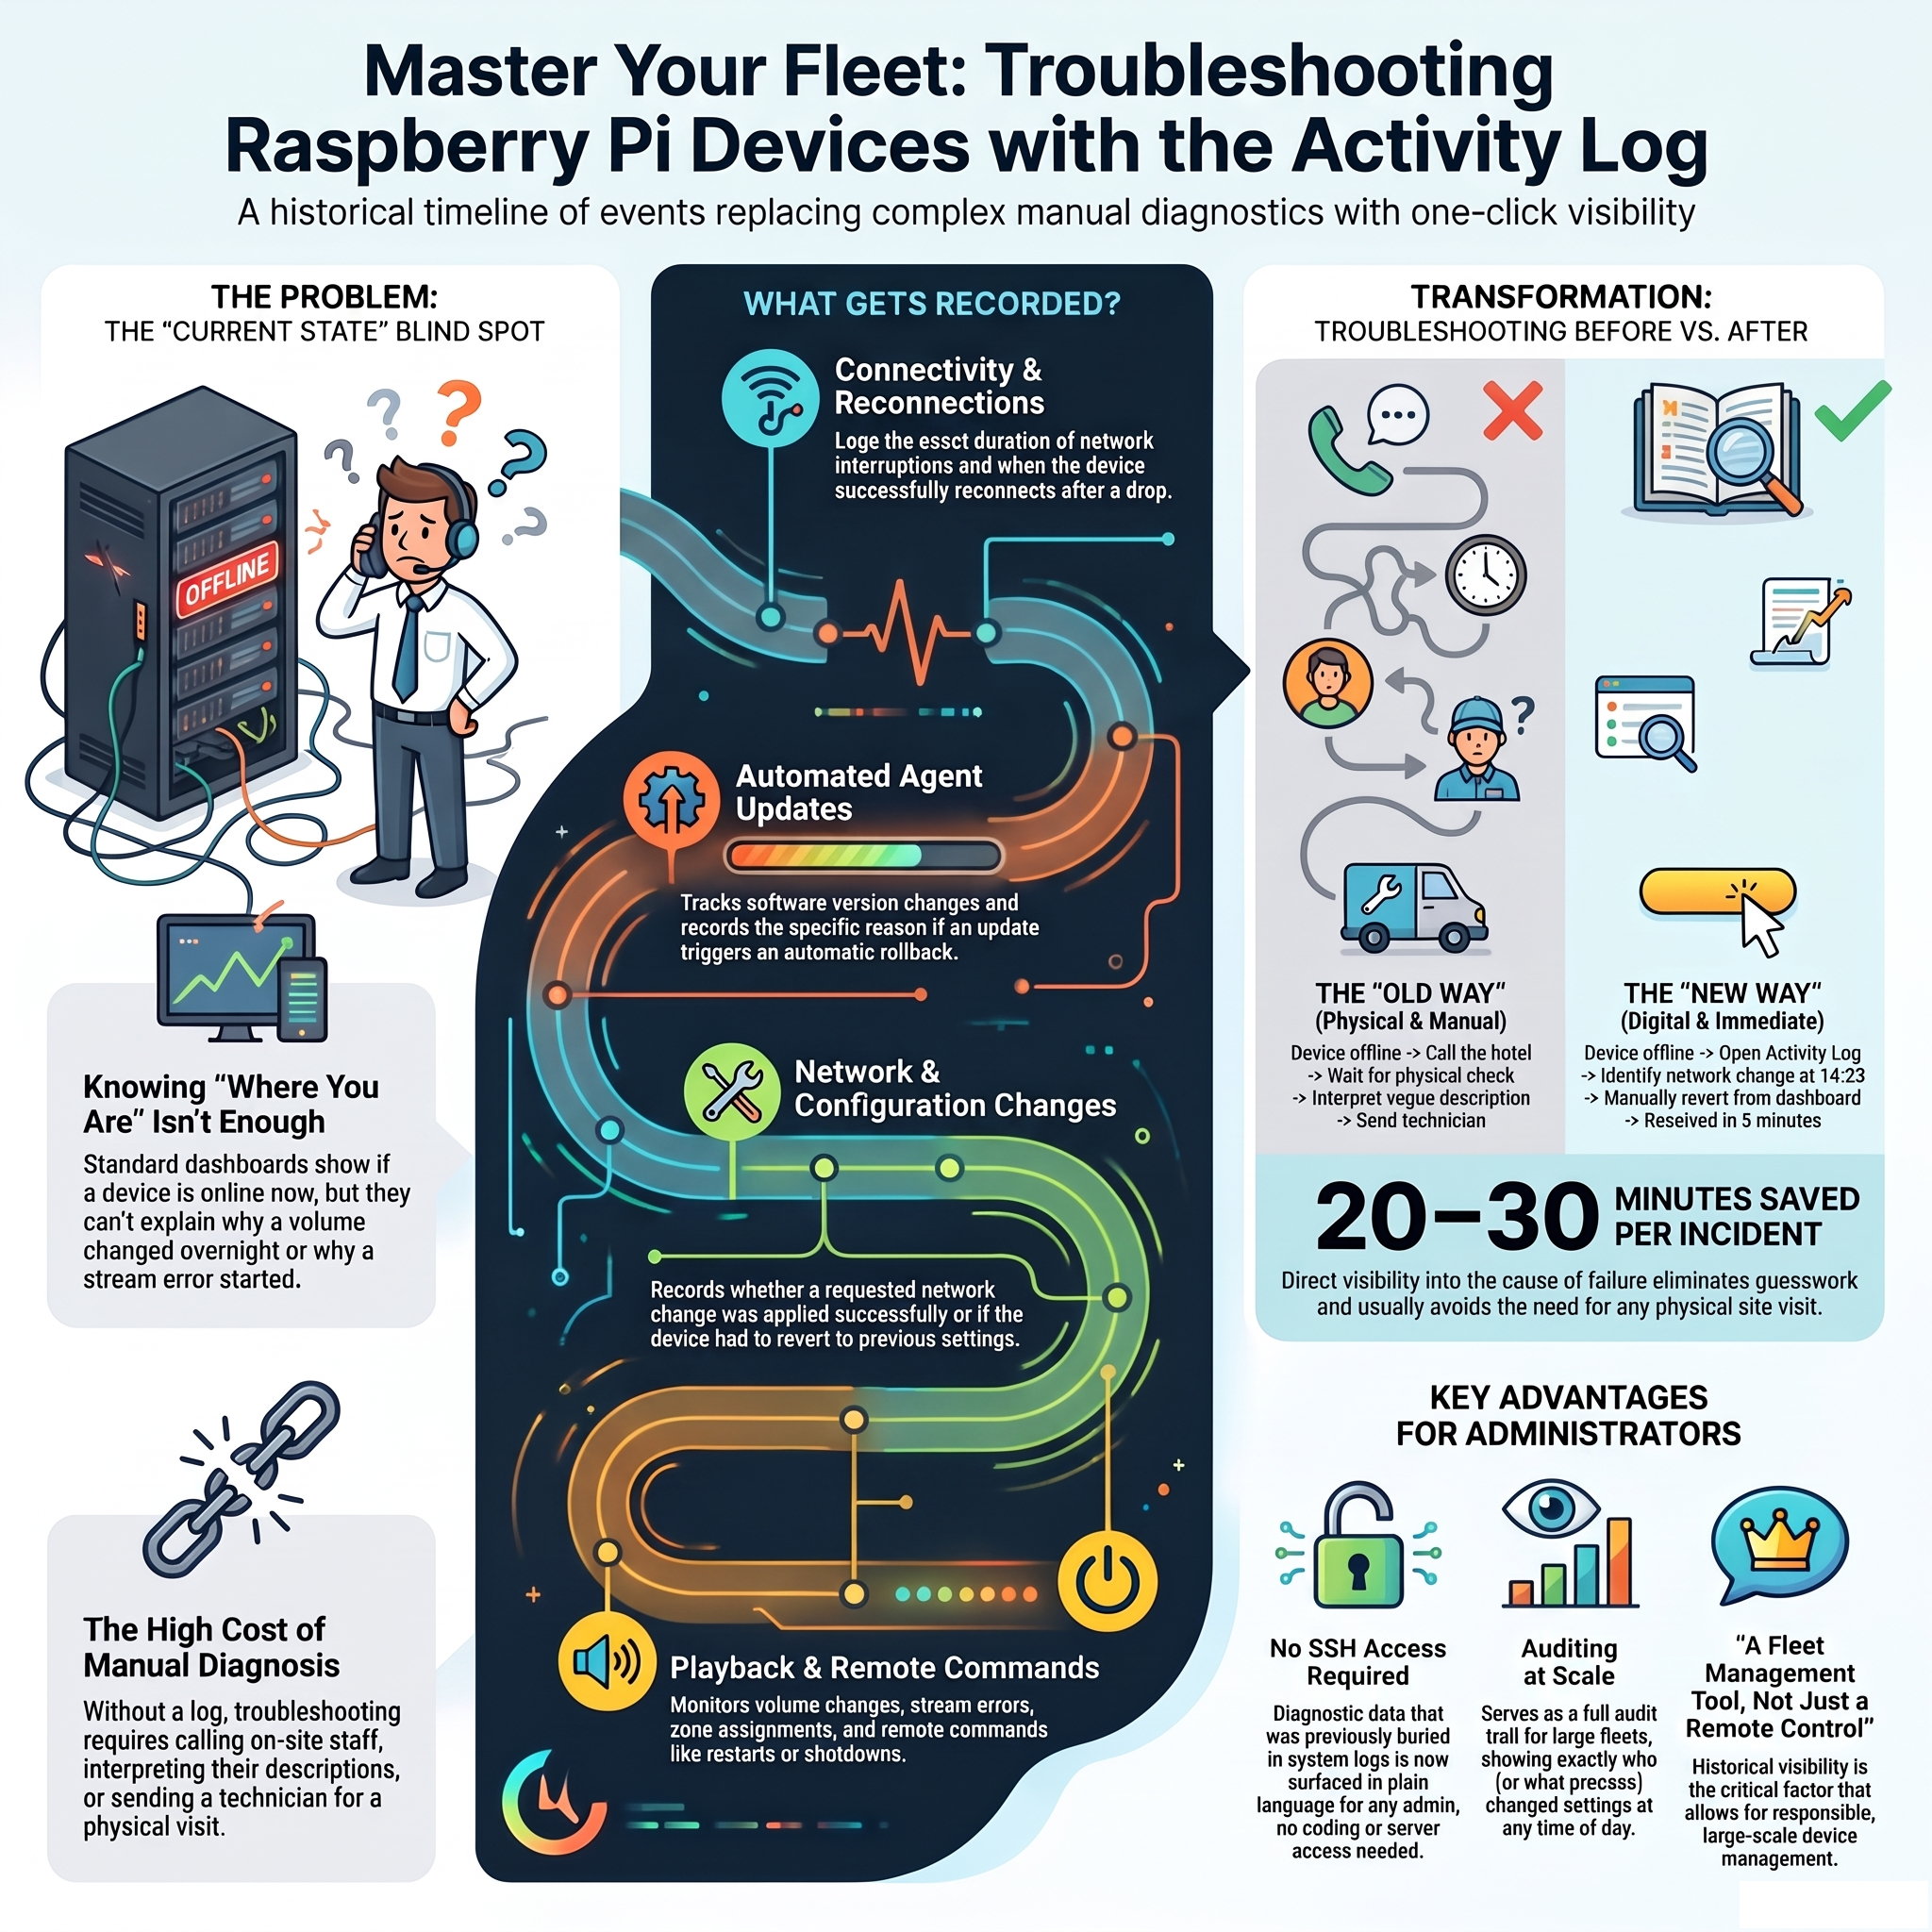
Until recently, the dashboard showed the current state of each device: whether it is online, what it is playing, at what volume. That is useful for monitoring, but it does not answer the question that comes up every time something does not add up.
A device appears offline with no obvious reason. A volume changed overnight without anyone touching it from the dashboard. A device that was working fine yesterday is now showing a stream error. The current state tells you where you are. It does not tell you how you got there.
The new Activity Log tab, available on every device's configuration page, resolves exactly this.
What Gets Recorded
Every significant event on a device is now logged with a timestamp, the type of event, and the relevant details:
- Reconnections after a drop, with the exact duration of the interruption.
- Agent auto-updates, showing the previous version and the new one — and, if the update triggered an automatic rollback, the reason why.
- Playback state changes — playing, paused, stream error — so you can see whether a problem is ongoing or resolved itself.
- Network configuration changes: not just that a change was requested, but whether it was applied successfully or whether the device reverted it automatically.
- Volume, pause, and stream changes, whether made from the admin dashboard or from a player screen on-site.
- Zone and hotel assignments, remote commands (restart, shutdown), and player access code resets.
A Concrete Example
A device has been offline for 40 minutes. Under the old dashboard, the only information available was "last seen: 40 minutes ago." The next step would be to call the hotel, ask someone to physically check the device, and try to interpret their description of what they see.
With the activity log, the picture is immediate: a network configuration change was applied 42 minutes ago, and the device has not connected since. That points directly to the network change as the cause — the device is likely unreachable because the new IP or gateway was wrong, and (if the automatic revert timer has not yet fired) it may recover on its own in the next few minutes. If it does not, the next step is clear: revert the network configuration manually and try again with the correct settings.
The difference between "something went wrong, go investigate" and "the network change at 14:23 broke connectivity" saves 20–30 minutes of diagnosis and usually avoids the physical visit entirely.
Before the activity log: device offline → call the hotel → wait for someone to look → interpret their description → still unclear → send a technician.
After: device offline → open activity log → network change applied 42 minutes ago → check if auto-revert fired → if not, manually revert from dashboard → resolved in 5 minutes.
No SSH Required
This level of diagnostic detail previously existed only for someone with direct server access and the knowledge of where to look. The information was always there, buried in system logs, but retrieving it required technical access that most hotel IT administrators do not have — and should not need.
The activity log surfaces this data directly in the dashboard, for any administrator with access to that device. It is not a raw log — it is a structured timeline of meaningful events, in plain language, that anyone managing the device can read and act on.
Auditing at Scale
For groups managing large fleets, the activity log also serves as an audit trail. If a zone's volume was changed at 2 AM on a Saturday, the log shows whether it was changed from the admin dashboard, from a player screen, or by the device's own automatic recovery process. If a device updated itself to a new agent version last Tuesday and has been working fine since, that is recorded. If that same update caused a rollback, that is recorded too, with the failure reason.
This kind of visibility is what separates a fleet management tool from a simple remote control. The ability to look back at what happened, without needing log-level server access, is what makes it possible to manage a large fleet responsibly.
Know exactly what happened on every device, any time
RoomStream's per-device activity log gives your IT team the context they need to diagnose and resolve issues without site visits.
Learn more about RoomStream →